30% of your revenue happens while you sleep
Founders don’t buy software during business hours, they buy software when it’s most convenient for them. That often happens after hours at 9 pm, 12 am, or even
An hour before her board call, a founder pulls her net revenue retention number. It reads 92%. She doesn't know whether that's a problem or exactly where a company her size should be, and her team can't give her a straight answer either.
The gap between having the number and understanding it is where a lot of founders get stuck. This article clears it up. You'll get a plain definition of net revenue retention, the formula worked out with examples above and below 100%, and real benchmarks for private SaaS at each size, not the inflated figures built for public companies at scale. You'll also learn the one metric to always read next to NRR, since on its own it can hide a churn problem that's quietly eating your base.
Retention matters more now than it used to. Expansion revenue now drives around 40% of new ARR on average, with a share weighted toward larger B2B SaaS companies, and with acquisition costs rising, selling more to the customers you already have has become the cheaper path to growth.
Net revenue retention (NRR) is the percentage of recurring revenue a company keeps from its existing customers over a set period, after expansion and losses. Expansion covers upsells, cross-sells, and price increases. Losses cover downgrades and churn. NRR looks only at the customers you already had at the start of the period; new business is left out on purpose.
Exclusion is what sets NRR apart from gross revenue growth. New signups can paper over a lot. Strip them away, and you see how the customers you already earned are actually behaving, which is why NRR is called a same-cohort measure: the same group of accounts, tracked start to finish.
Because expansion sits at the top of the calculation, NRR can climb past 100%. A company at 105% pulls more money each year from its current base without signing a single new logo. A company at 90% runs the other way and has to win back 10% of its revenue annually just to hold flat.
That mechanism is why investors watch the number closely. NRR above 100% means existing customers are producing extra revenue at zero acquisition cost, one of the clearest reads on capital efficiency a SaaS business can offer. The spread shows up directly in valuation: companies with NRR below 90% trade around 1.2x revenue, the 100–110% range commands roughly 6x, and NRR above 120% pushes multiples to 8x or higher, a 63% premium over the market median. A 10-point NRR improvement alone can add 20 to 30 percent to a company's exit value.
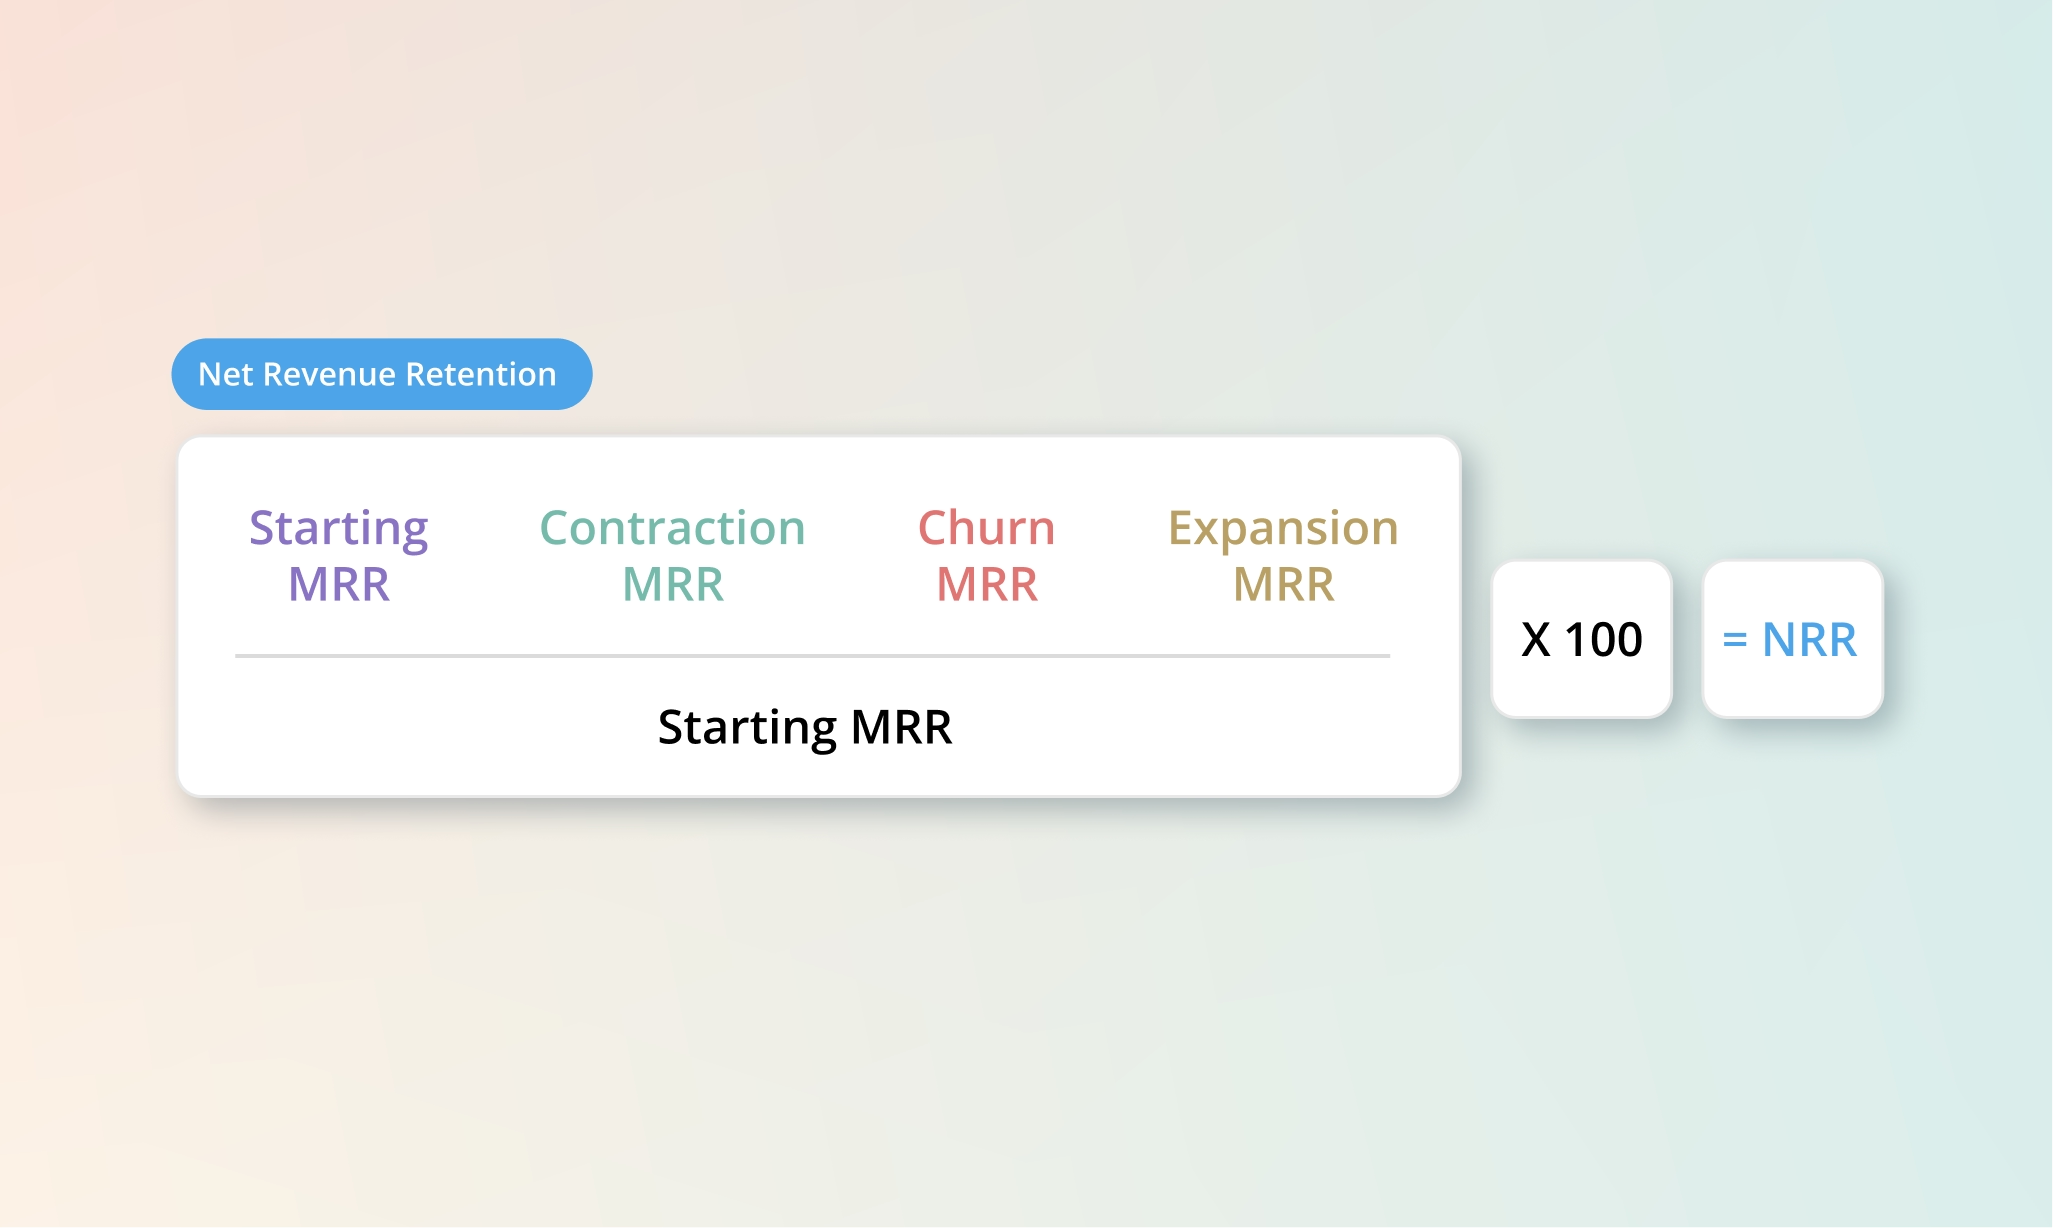
The NRR formula is:
(Starting MRR + Expansion MRR − Contraction MRR − Churned MRR) ÷ Starting MRR × 100
Notice that the denominator includes only the revenue you started with. A fixed denominator is what keeps the comparison honest, as you're weighing the cohort's ending revenue against its own starting revenue, so a strong quarter of new sales can't inflate the result.
Four inputs feed the formula, and each tracks a different thing that happened to your starting group of customers:
The number lands above or below 100% depending on one thing: whether expansion outweighs contraction and churn combined. Two examples make that clear.
Above 100%. Say your cohort starts at $200K MRR. Over the period, they add $20K in expansion, give back $1K to contraction, and lose $2K to churn.
Run it: ($200K + $20K − $1K − $2K) ÷ $200K = 108.5%. That cohort paid you 8.5% more at the end than it did at the start, without a single new logo. This is the position every SaaS company wants to be in, where the base grows on its own, so new sales become extra momentum rather than the only thing keeping you afloat.
Below 100%. Same $200K starting point, different behavior. Expansion comes in at just $4K, contraction climbs to $6K, and churn hits $14K.
Run it: ($200K + $4K − $6K − $14K) ÷ $200K = 92%. The same-sized cohort paid you 8% less by period end. Here, every new deal your team closes has to cover that shortfall before it adds anything, which quietly raises the sales target the whole company is chasing.
The two results sit only about 16 points apart, but they describe very different companies. In the first, growth compounds inside your existing base. In the second, you're losing ground and have to sell new deals just to stay even. This shift is also why one healthy company can post 108% one quarter and 95% the next—expansion and churn rarely move in lockstep—so the ratio between them shifts period to period.
The number everyone quotes is 120–125%. It gets passed around as the mark of a healthy SaaS company, and it sends a lot of founders into a quiet panic when their own figure lands 30 points lower. Remember that this range comes from large public SaaS companies operating at scale. Holding a private company in its early growth stage to it sets off a false alarm, and it's the single most common reason founders think something is broken when it isn't.
Private companies earlier in their growth run lower, and that's normal. ChartMogul's analysis of thousands of SaaS businesses gives a clearer picture of where real companies actually sit by revenue band:
Read that top row again. Even the best companies under $300K in ARR cluster around 79%, well beneath the public-market number. Retention climbs as companies scale, product-market fit tightens, and expansion motions start to repeat reliably. A figure that would signal trouble at $20M ARR can be completely healthy at $2M.
SaaS Capital's survey of 1,500+ private SaaS companies finds a similar pattern by contract size: median NRR sits at 102% for accounts with $25K–$50K ACV.
Zooming out to the whole market fills in the rest. Benchmarkit's 2025 data puts median NRR across B2B SaaS at 101%, with median gross revenue retention at 88%, which is the reason retention has moved to the center of how healthy companies grow.
So the honest answer to "what's a good NRR?" is: it depends on your size. Find your revenue band, compare against companies actually in it, and ignore the number built for businesses ten times your scale.
Gross revenue retention (GRR) is the floor version of NRR. It uses the same cohort but leaves expansion out completely, so it can never rise above 100%. Stripping away the expansion cushion is the whole point because what's left is a clean look at how much revenue you lost to downgrades and churn, with nothing dressing it up.
That's why the two numbers work best side by side. NRR shows the full story after expansion; GRR shows the damage underneath it. The distance between them tells you how much of your headline number is real retention versus expansion, covering for losses:
Consider a company reporting 120% NRR next to 75% GRR. On the surface, 120% looks excellent. Underneath, that 75% GRR means it's bleeding roughly a quarter of its base revenue every year, and expansion is just papering over the hole. Stripe puts the risk plainly, stating that a strong NRR can sit right on top of a business that's steadily losing customers. Maxio draws a hard line on it. Saying that GRR below 85% paired with NRR above 115% means the expansion win is temporary, and churn will catch up.
The takeaway for the founder heading into that board call is simple. Never report NRR on its own. Pull GRR next to it first, because only together do they tell you whether your retention is actually healthy.
If you have run into "net dollar retention" and wondered how it differs from net revenue retention, here's the short answer: it usually doesn't. Across the SaaS industry, NRR and NDR describe the same thing. Which term you see comes down to which company or report you happen to be reading, not a real difference in the math.
The naming gets messier the closer you look. Ordway Labs studied more than 135 publicly traded SaaS companies and found the same metric reported under more than a dozen labels. Dollar-Based Net Retention Rate (DBNRR) led at about 30% of companies, with Net Dollar Expansion Rate, Net Revenue Retention Rate, and Net Dollar Retention Rate close behind. Same calculation, a dozen different names on the filing.
💡NRR tends to describe retention measured across a full cohort of customers, while NDR sometimes refers to the same measure at the individual account level. That difference can surface in enterprise customer success work and investor due diligence. For a founder reporting company numbers, though, the two are interchangeable.
Your NRR is only as trustworthy as the data feeding it. The formula almost never breaks. The inputs do.
For most companies that have outgrown a Stripe-and-spreadsheets setup, the four pieces that NRR depends on—expansion, contraction, renewals, and churn—live in different places. Some sit in Stripe. Some sit in a CRM. Renewal dates hide in scattered documents and email threads. When finance and customer success each pull the numbers their own way, they walk into the same meeting with two different NRR figures for the same set of customers.
Here's how that system breaks down in practice. A rep closes a contract upsell and logs it in the CRM, but it never makes it into billing, so one report counts expansion while the invoices show none. Run it the other way, and the gap flips: a customer drops from an annual plan to a smaller tier mid-year, the change lands in billing, but nobody updates the CRM. Now finance records the contraction, but sales still shows the old contract value. Same customers, same month, numbers that refuse to agree. The math was right every time. The data underneath it was not.
At this point, NRR stops being a customer success question and becomes a system-of-record one. What these teams need is a single place where expansion, contraction, renewals, and churn all get recorded the same way, every time.
That's the job Salesbricks does. It captures the inputs to NRR, including CPQ, billing, and renewals, inside one connected workflow, so the numbers feeding the formula line up across finance, customer success, and the founder's board deck. Stripe is the card reader; Salesbricks is the point-of-sale system around it. You keep Stripe for processing payments, and Salesbricks handles the pricing, contracts, and renewals that decide what those NRR inputs actually are.
The payoff shows up the next time an investor or CFO asks the two-part question every founder eventually hears – ‘What's your NRR, and how did you calculate it?’ Instead of stitching together four exports and hoping they agree, you answer from one source of truth. That's the line between a number you can defend and a number that leaves you exposed.
Start with the basics. Calculate NRR using the four-component formula, then hold it against the benchmark for a company your size, not the 120–125% figure built for public companies at scale. Then pull GRR alongside NRR to check that expansion isn't hiding churn underneath a healthy-looking headline.
Once the math checks out, ask the harder question: are the inputs clean? If expansion, contraction, churn, and renewals are in four different tools, your number is fragile no matter how carefully you calculated it. Fix that before the next board meeting, not during it.
Salesbricks captures every one of those inputs in one place for companies graduating from Stripe. Book a demo and walk through your own numbers end to end.