Track All Your Revenue Vitals with Our New ‘Reports & Charts’

Mendy Shlomo
Brand and Content Lead
@
Salesbricks

Hello? Are you feeling alright?

Well, how could you really know the answer without putting your finger on your pulse and shining a flashlight into your eyes to track your vital signs?

(Is this how to check your vitals? Whatever, I’m not a doctor.)

Anyhow, we are so excited to announce that our new Reports & Charts feature is currently in beta! It provides a better way for businesses to keep an eye on their most vital metrics in a single source of truth. Because these metrics aren’t just nice to have — they are the best way for you to track the health of your organization.

Now pick your jaws up off the floor and keep reading to learn all about it.

Why Reports & Charts?

First of all, we’re on a mission to make B2B sales as seamless and delightful as B2C, so this is one huge piece of that puzzle.

Understanding your vitals as a SaaS business is critical to sustaining and growing over time. And yet we've seen B2B companies spend days trying to garner the most basic information about how things are going from their revenue and bookings to renewals and collections.

Unfortunately, it can sometimes take a literal village to extract critical vital information from your sales and finance organization. Often, actual business growth needs to be put on hold so that you can understand basic info such as monthly recurring revenue (MRR), bookings, customer count, renewals, and payment status.

So we said: That’s brickin’ ridiculous. There’s got to be a better way.

What can you do with Reports & Charts?

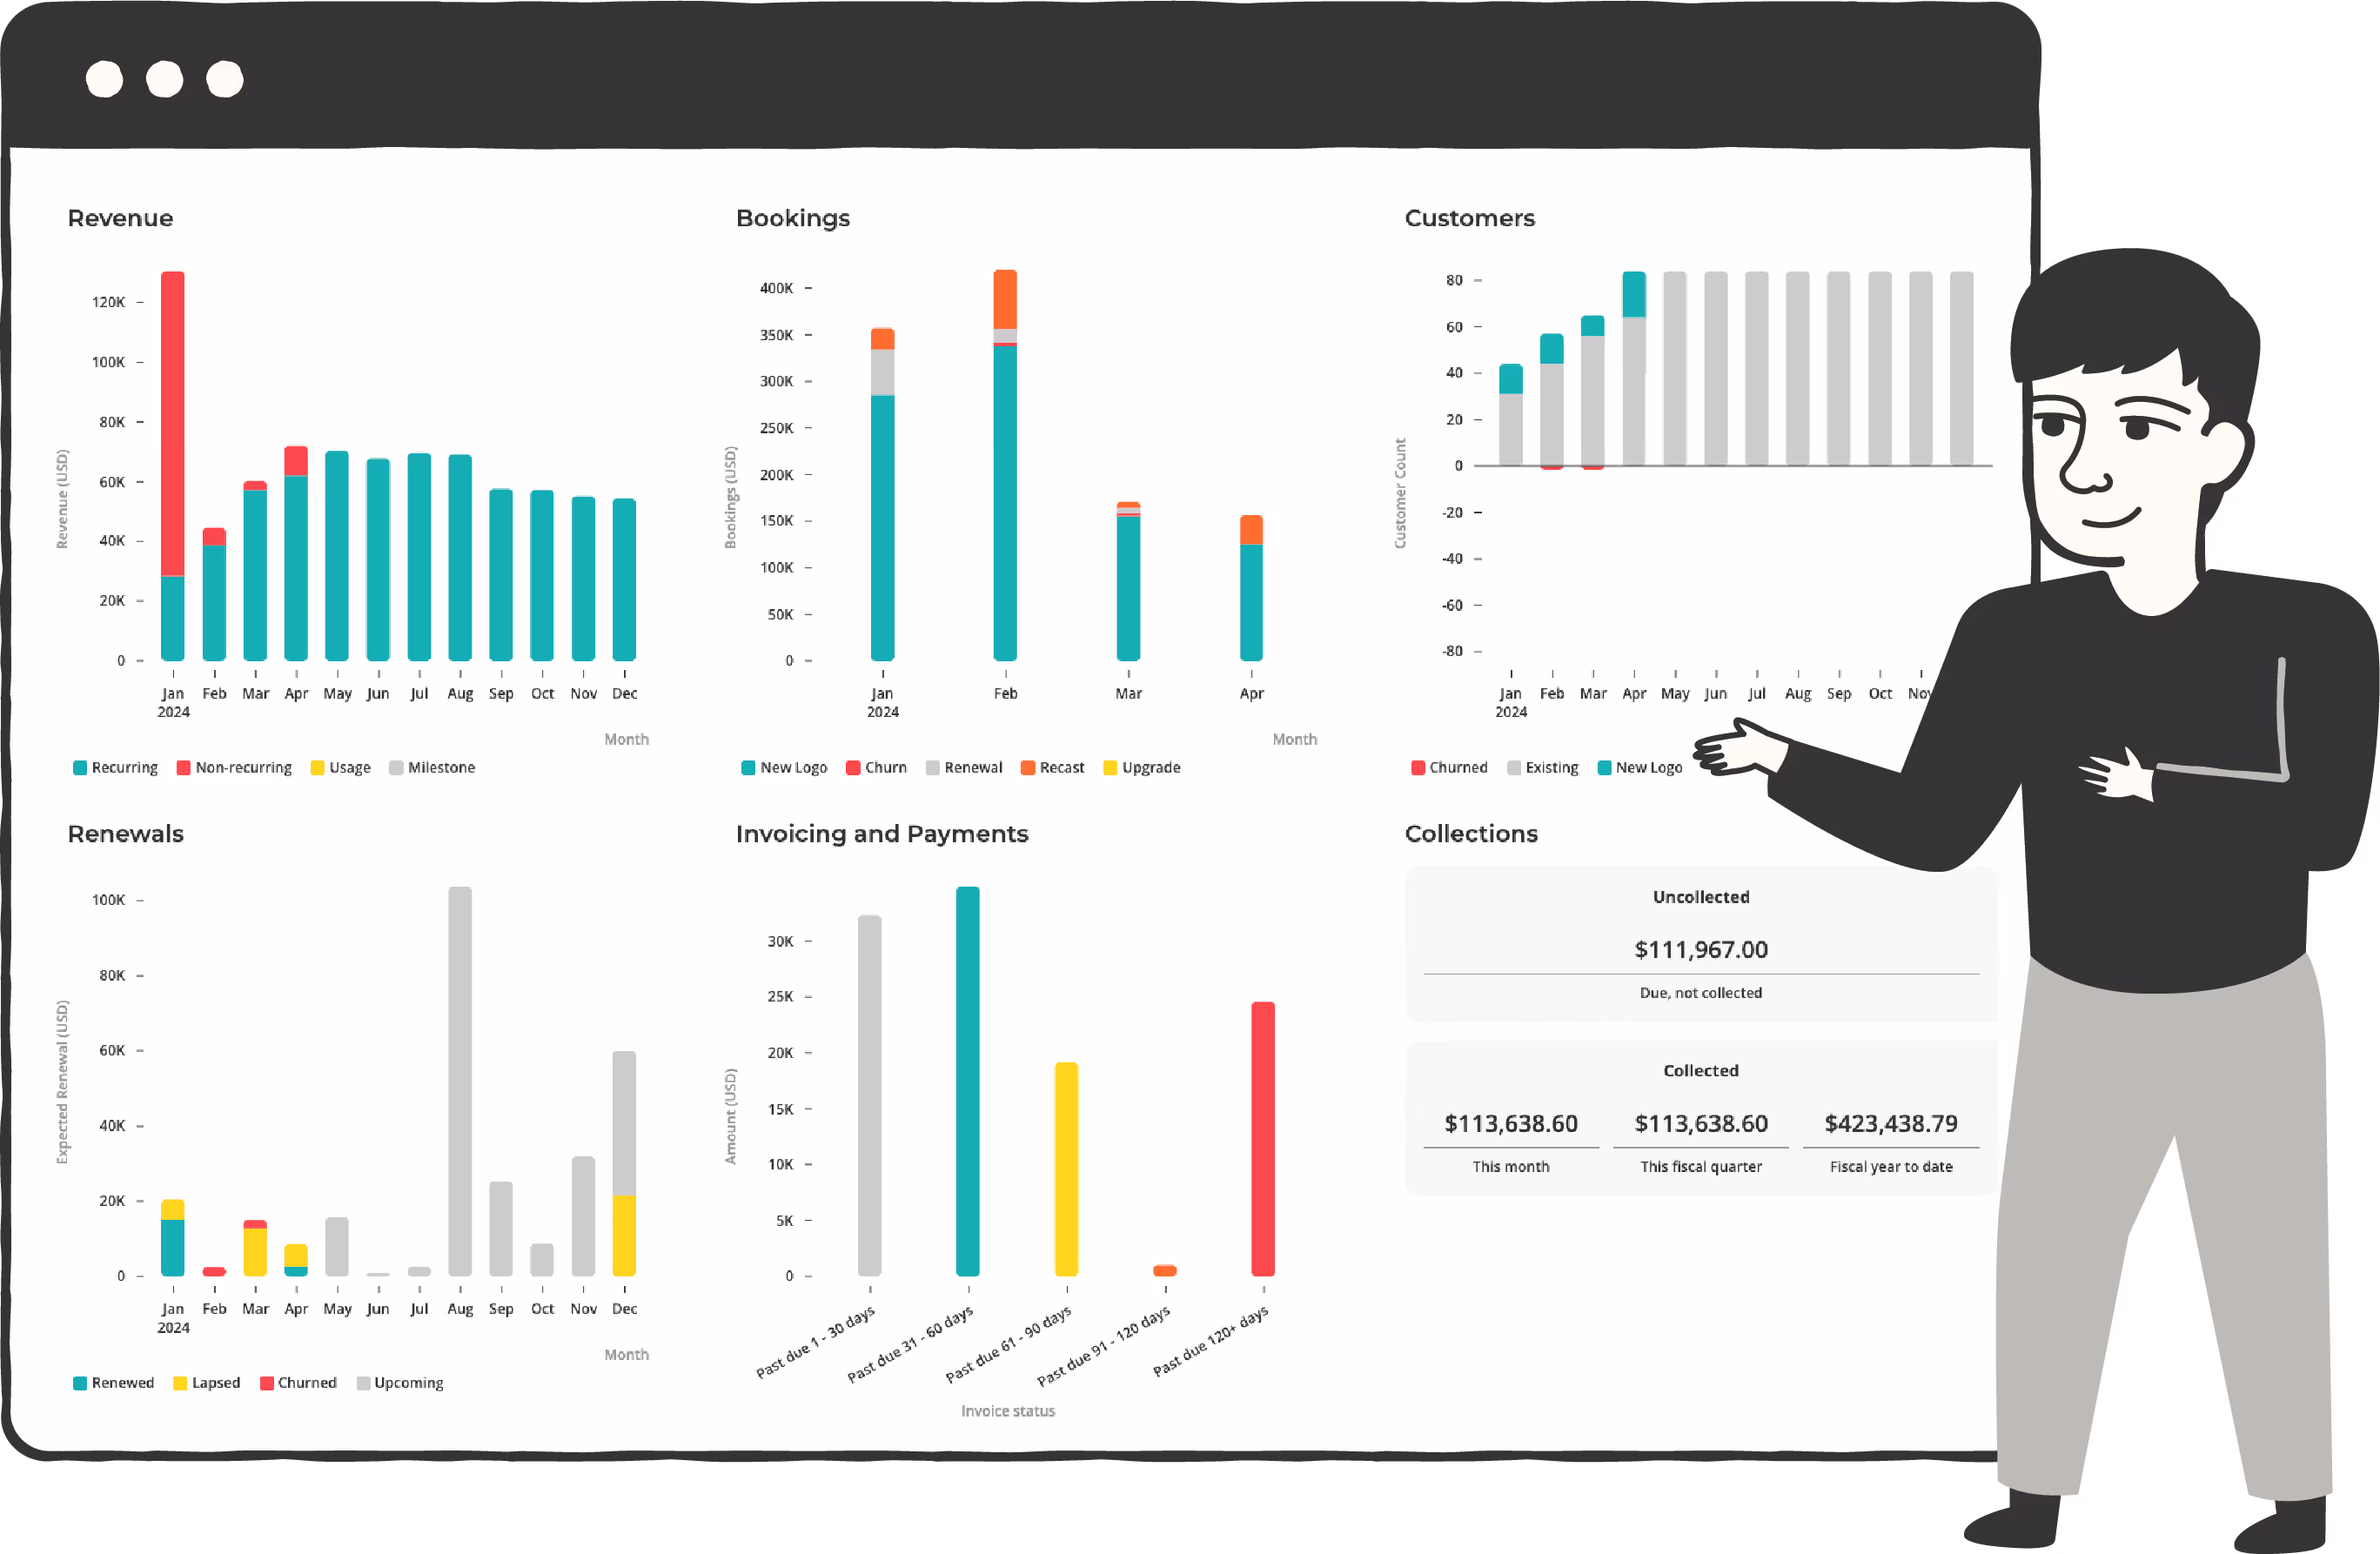
If we were gonna be smug about it, we’d say our Reports & Charts give you all the data you need in seconds to effectively grow your business. But we’ll try not to be too smug.

Instead, here’s a list of the crucial data we provide:

  • Revenue - Keep track of all the money coming in. In one glance, track your recurring revenue, non-recurring revenue, usage-based revenue, and milestones.

    Currently, many fast-growing startups struggle to properly track and report their MRRs. That’s because it can require a lot of revenue operation discipline to properly gather this information and build accurate reports for both investors and teammates. Rather than making you invest in other tools, Salesbricks automatically captures this critical data in our revenue chart so that immediately after deals close, you can see how they impact your overall business.
  • Bookings - See all the business brought in each month, broken down by new logos, churn, renewals, recasts, and upgrades.
    Unlike revenue data, bookings is a sales performance metric used by sales teams to track how the team and company is performing against their targets. It tracks the total amount of commitment of spend by subscription, services, and usage.

  • Customers - This chart shows you your new, existing, and lost customers.

    Now, you may think that keeping track of your customers is easy. Well, that’s not necessarily the case. Being able to articulate how many customers you have at a particular date and time can be very hard if you don’t have the right tracking in place. Thankfully, since we know every transaction, start date, end date, and renewal status, we can easily show how many customers are active and in good standing at any given point in time.
  • Renewals - See all your renewal counts and amounts in one place.

    Until now, it was not easy to understand which customers are renewing, at what date, and for what amount. Many early stage companies manage multiple spreadsheets and juggle through unreliable CRM data to track who’s renewing their contracts. That’s why we created this easy-to-read visual chart that tracks all your renewals and renewal amounts.
  • Invoicing and Payments - How much money do customers owe you? How much is way past due? You can see all that information in this chart.

    Collecting cash is a team sport yet all the data around which customers paid and which customers have overdue bills is often stuck in siloed tools. We believe this data should be easily accessible so companies can quickly reach out and drive down outstanding payables.
  • Collections - Keep a tally on the money that actually came in by month, quarter, and year, as well as what’s owed to you.

Let’s wrap up…

  • There are 9 main pricing models to choose from in SaaS. User-based, custom, hybrid, feature-based, freemium, tiered, flat rate, usage-based, and inverse pricing.
  • Pricing models need to make you money, keep clients happy, and increase your appeal in the marketplace
  • The pricing model you use can (and likely will) change over time. Make a choice now, but be prepared to change your mind later

We know you're busy

Get started in minutes, not months!

Book a demo

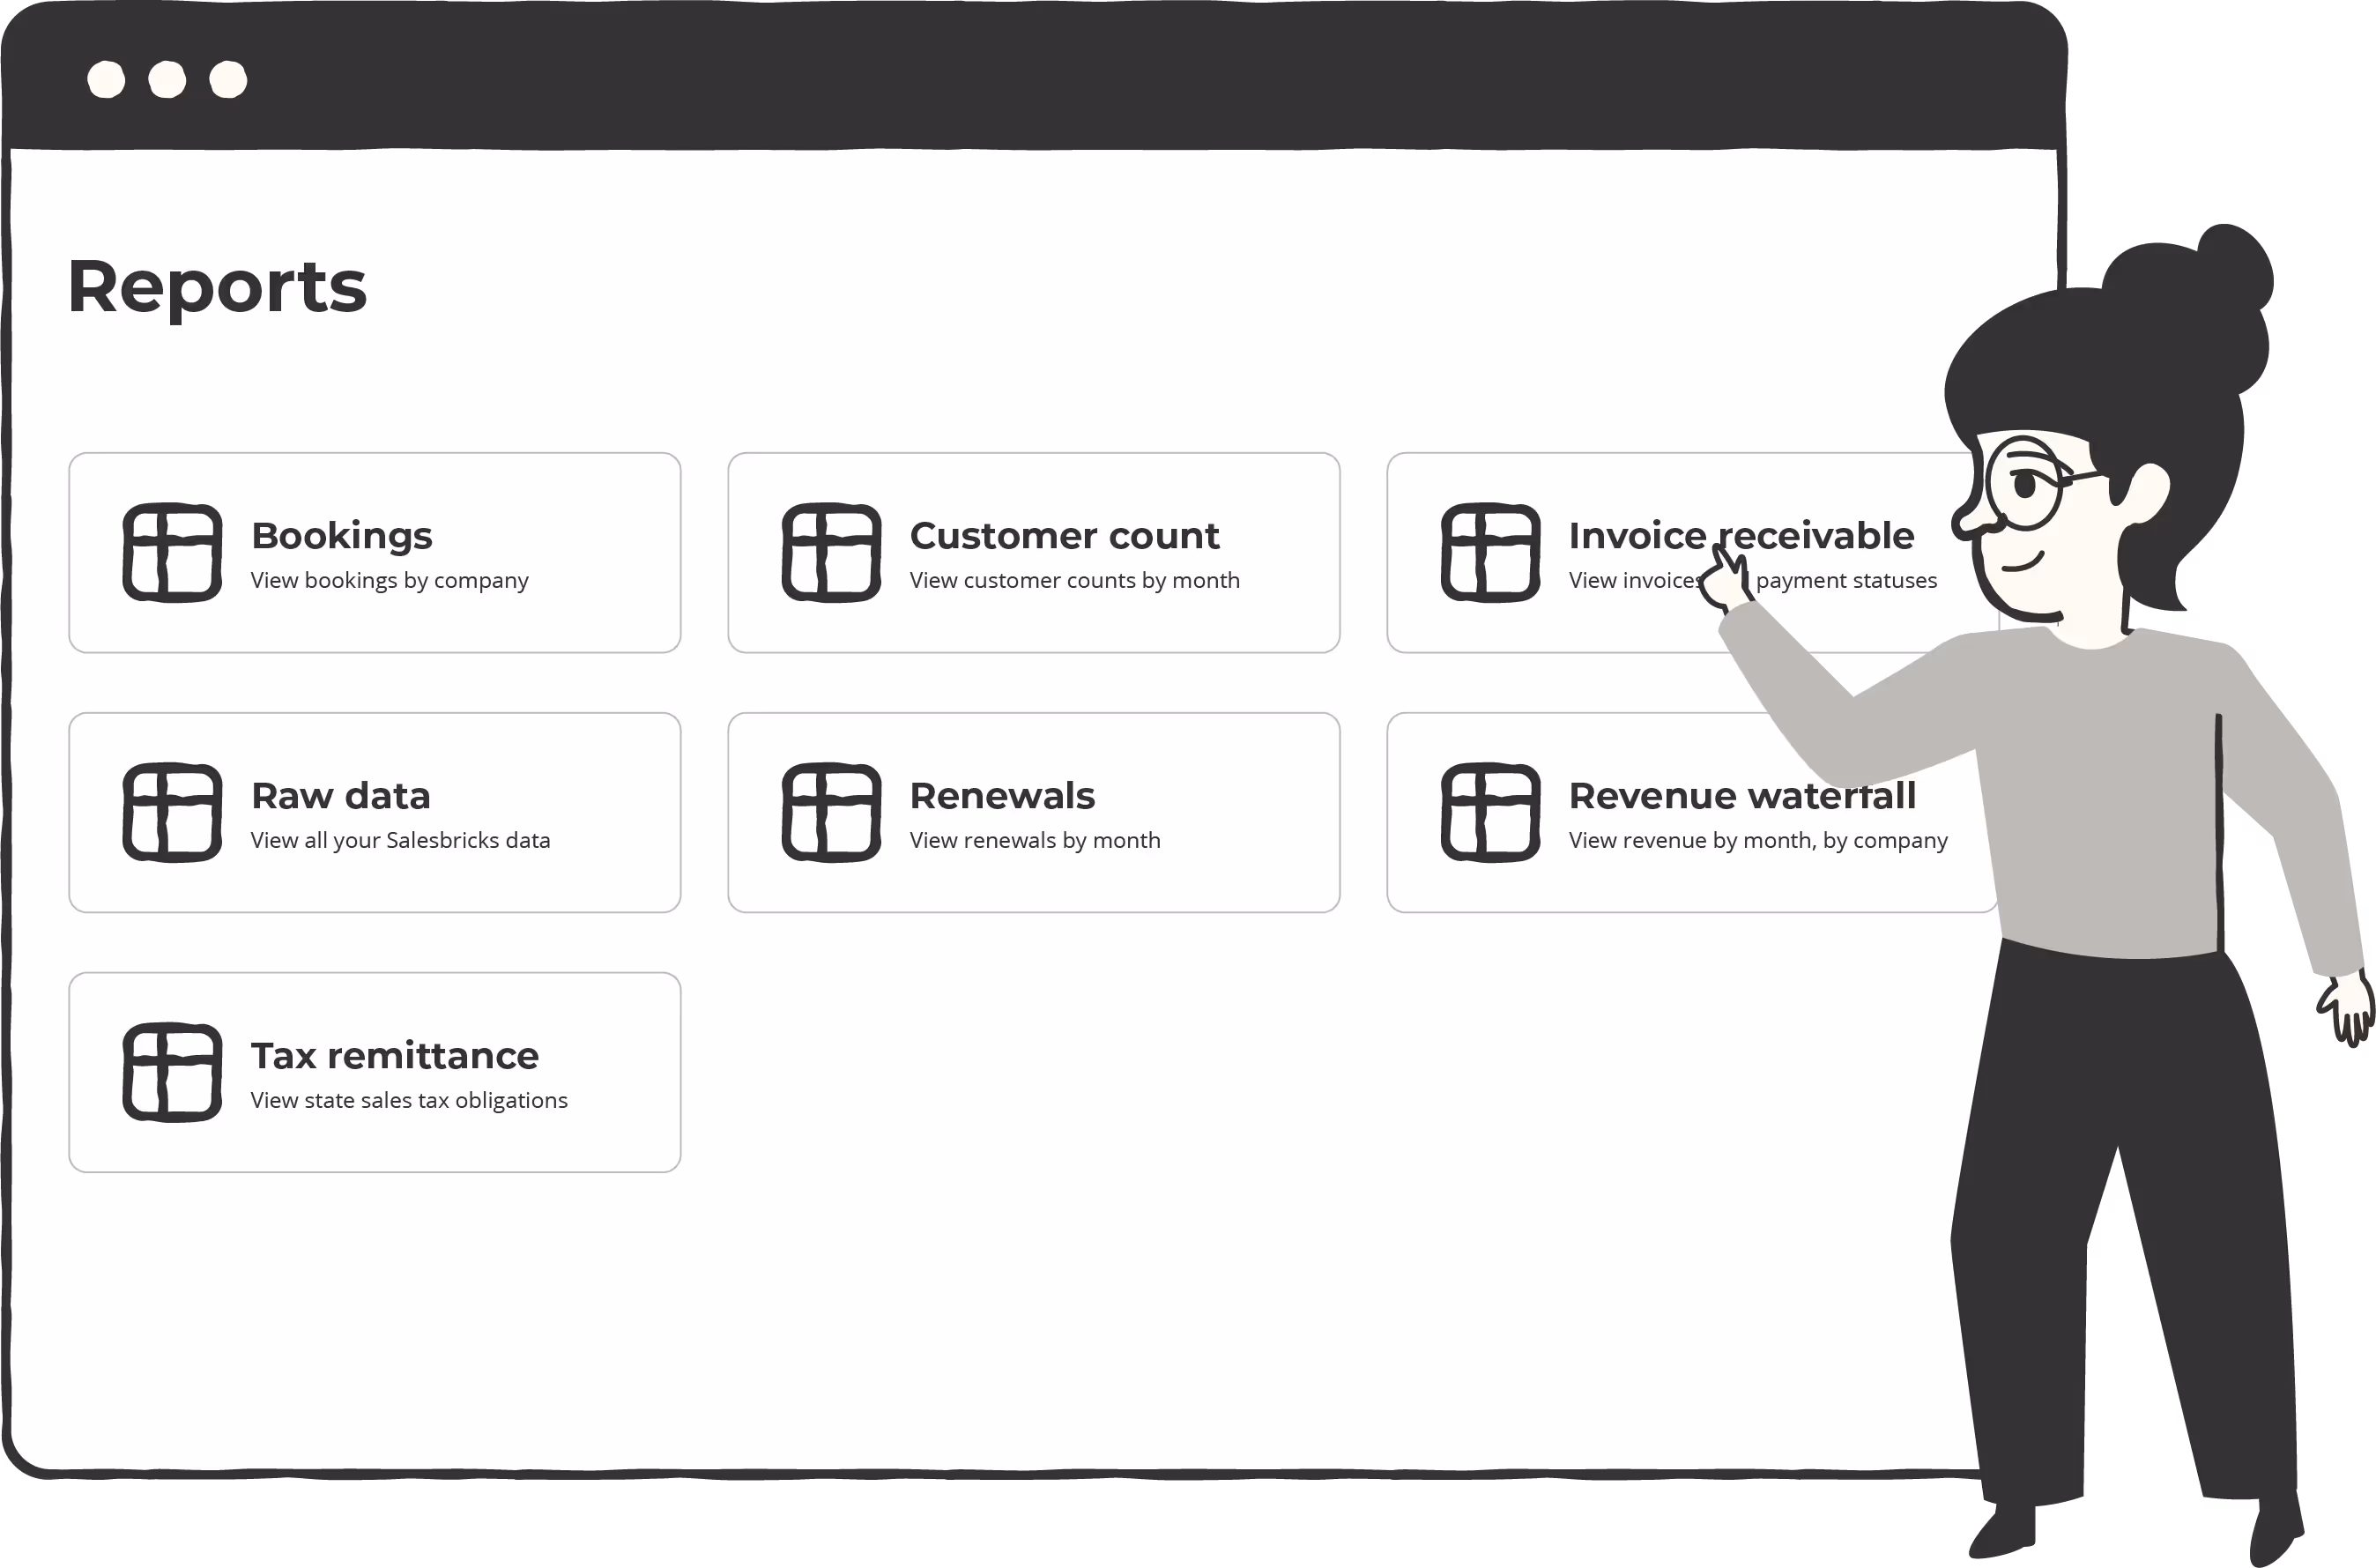
If that weren’t enough, we also provide you with a bunch of ready to view or download reports, like:

  • Bookings
  • Customer count
  • Invoice receivable
  • Raw data
  • Renewals
  • Revenue
  • Revenue waterfall
  • Tax remittance

Are you super excited yet?

Good.

Because by gaining all the insights you need in seconds — not days — you’ll know exactly how the team is doing as they close more deals. This will give your company the utmost competitive advantage to build fast, sell faster, and iterate at an unfair speed and velocity.

All you’ll need to do is close deals on Salesbricks and see these charts come to life.

Sounds a lot like B2C, right?

Exactly.

Want to learn more about how Salesbricks can simplify your revenue process?
Get Salesbricks now!